Learn how to effectively display process data in Excel workbooks using SIMATIC WinCC Data Monitor for enhanced data visualization and analysis.
In This Video:
In this tutorial, you will learn about displaying process data in Excel workbooks with SIMATIC WinCC Data Monitor. The key topics covered include:
- Data Visualization: Techniques for displaying process data in an easily understandable format.
- Chart Creation: Step-by-step instructions on creating various types of charts and graphs in Excel to represent process data.
- Data Integration: Methods to integrate real-time and historical data into Excel workbooks.
- Customization: Customizing the appearance and layout of data displays to suit specific needs.
- Best Practices: Tips for optimizing data presentation for better analysis and decision-making.
Watch the video below to master the skills of displaying process data in Excel workbooks using SIMATIC WinCC Data Monitor, enhancing your data visualization and analysis capabilities.

-
01 SIMATIC WinCC Data Monitor – Introduction
In this page you will learn about the DataMonitor in WinCC, a powerful tool for…
-
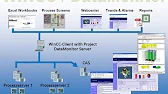
02 SIMATIC WinCC Data Monitor – Architecture
In this video, you will delve into the architecture of SIMATIC WinCC DataMonitor, a critical…
-
03 SIMATIC WinCC Data Monitor – Installation and Licensing
In this video, you will learn the essential steps for installing and licensing SIMATIC WinCC…
-
04 SIMATIC WinCC Data Monitor – Configuration
In this video, you will learn how to configure SIMATIC WinCC DataMonitor, focusing on access…
-
05 SIMATIC WinCC Data Monitor – Configuration Users
In this video, you will learn how to configure users in SIMATIC WinCC Data Monitor,…
-
06 SIMATIC WinCC Data Monitor – Configuration Access Rights
In this video, you will learn how to configure access rights in SIMATIC WinCC DataMonitor,…
-
07 SIMATIC WinCC Data Monitor – Web Configurator
Explore the capabilities of the Web Configurator in SIMATIC WinCC Data Monitor, enabling easy setup…
-
08 SIMATIC WinCC Data Monitor – Configuration Web Publisher
Discover how to configure the Web Configurator for seamless integration and effective data visualization with…
-
09 SIMATIC WinCC Data Monitor – Configuration Cient
Explore the Configuration Client of SIMATIC WinCC Data Monitor in this instructional video, guiding you…
-
10 SIMATIC WinCC Data Monitor – Configuration of Connections
Discover how to configure connections effectively in SIMATIC WinCC Data Monitor to ensure seamless communication…
-
11 SIMATIC WinCC Data Monitor – Trends and Alarms Overview
Discover how to effectively monitor trends and alarms with SIMATIC WinCC Data Monitor. Gain insights…
-
12 SIMATIC WinCC Data Monitor – Trend Process Values
Explore how to trend process values using SIMATIC WinCC Data Monitor, allowing you to analyze…
-
13 SIMATIC WinCC Data Monitor – Alarm Hit List
Learn the ins and outs of managing alarms effectively with the Alarm Hit List feature…
-
14 SIMATIC WinCC Data Monitor – Alarm Table
Explore the functionalities of the Alarm Table feature in SIMATIC WinCC Data Monitor, enabling efficient…
-
15 SIMATIC WinCC Data Monitor – Displaying Process Values Statistics
Learn how to effectively display process values statistics using SIMATIC WinCC Data Monitor, enabling comprehensive…
-
16 SIMATIC WinCC Data Monitor – Web Center Administration
Unlock the full potential of SIMATIC WinCC Data Monitor with comprehensive Web Center administration techniques.…
-
17 SIMATIC WinCC Data Monitor – Web User Administration
Gain mastery over web user administration in SIMATIC WinCC Data Monitor for streamlined access control…
-
18 SIMATIC WinCC Data Monitor – Web Center Pages
Learn to design and customize web center pages in SIMATIC WinCC Data Monitor for optimal…
-
19 SIMATIC WinCC Data Monitor – Web Center Custom Layouts
Discover how to create tailored web center layouts in SIMATIC WinCC Data Monitor for comprehensive…
-
20 SIMATIC WinCC Data Monitor – Excel Workbooks
Unlock the power of Excel integration with SIMATIC WinCC Data Monitor for enhanced data analysis…
-
21 SIMATIC WinCC Data Monitor – WinCC Server
In this tutorial, you’ll learn about the critical aspects of managing the WinCC Server in…
-
22 SIMATIC WinCC Data Monitor – Excel Workbooks Wizard
Unlock the full potential of SIMATIC WinCC Data Monitor by mastering the Excel Workbooks Wizard…
-
23 SIMATIC WinCC Data Monitor – Excel Workbooks Online Tags
Enhance your data monitoring capabilities by learning how to use online tags within Excel workbooks…
-
24 SIMATIC WinCC Data Monitor – Excel Workbooks Server Settings
Discover how to configure server settings for Excel workbooks in SIMATIC WinCC Data Monitor to…
-
25 SIMATIC WinCC Data Monitor – Excel Workbook Archive Tags
Master the setup of archive tags in Excel workbooks using SIMATIC WinCC Data Monitor to…
-
26 SIMATIC WinCC Data Monitor – Excel Workbook Alarms
Master the setup and management of alarms in Excel workbooks using SIMATIC WinCC Data Monitor…
-
27 SIMATIC WinCC Data Monitor – Excel Workbook Displaying Data
Learn how to effectively display process data in Excel workbooks using SIMATIC WinCC Data Monitor…
-
28 SIMATIC WinCC Data Monitor – Excel Workbook Over the Intranet
Learn how to share and manage Excel workbooks with SIMATIC WinCC Data Monitor over an…
-
29 SIMATIC WinCC Data Monitor – Creating XML Configuration File
Discover how to create XML configuration files for streamlined data monitoring and analysis with SIMATIC…
-
30 SIMATIC WinCC Data Monitor – Remote Workbook Wizard via XML
Explore the Remote Workbook Wizard via XML in SIMATIC WinCC Data Monitor for seamless remote…
-
31 SIMATIC WinCC Data Monitor – Reports
Discover the capabilities of generating insightful reports in SIMATIC WinCC Data Monitor, empowering informed decision-making.…
-
32 SIMATIC WinCC Data Monitor – Prepare an Excel Workbook for Reports
Learn how to optimize Excel workbooks for generating comprehensive reports in SIMATIC WinCC Data Monitor.…
-
33 SIMATIC WinCC Data Monitor – Create a PDF Report
Discover how to generate PDF reports efficiently using SIMATIC WinCC Data Monitor. In This Video:…
-
34 SIMATIC WinCC Data Monitor – Configure the E-mail Service
Learn how to set up and configure the email service in SIMATIC WinCC Data Monitor…
-
35 SIMATIC WinCC Data Monitor – Sending E-mail Reports
Explore how to effortlessly send email reports using SIMATIC WinCC Data Monitor, streamlining data distribution…
Learn to display process data in Excel workbooks using SIMATIC WinCC Data Monitor for enhanced data visualization and analysis.
